



Most firms don't have a revenue problem. They have a timing problem dressed up as a revenue problem.
The partners look at the pipeline, see $2.4M in active and prospective work, and mentally spend it. Then July arrives, three matters that were "basically closing" stall, a big contingency settlement pushes to Q1, and suddenly payroll feels tight even though year-to-date billings look fine. Nobody was lying. The pipeline was real. The forecast was just built on the assumption that a signed engagement equals cash, and that recognized revenue equals money in the account.
Those are three different things, and the gap between them is where firms get blindsided.
This is about connecting the parts most firms track separately: the probability a matter advances through each stage, the revenue that gets recognized as it does, and the cash that actually lands in the bank weeks or months later. Map all three onto the same timeline and matter pipeline forecasting stops being a spreadsheet guess and starts being something you can staff and spend against.
Why the standard pipeline number is almost always wrong
Walk into most small and mid-size firms and the "forecast" is one of two things: a weighted pipeline number pulled from the CRM, or a partner's gut feel about what's landing this quarter. Both fail for the same underlying reason — they collapse three separate variables into one.
Here's what's actually inside a single number like "$800k expected this quarter":
-
Stage probability — how likely each matter is to actually reach the point where you can bill for the work.
-
Realization — how much of the budgeted or engaged value you'll actually recognize as revenue (write-downs, scope changes, fee caps eat into this constantly).
-
Cash timing — when the recognized amount converts to deposited cash, which depends on your billing cycle, client payment behavior, and matter type.
A litigation matter and a flat-fee transactional matter of the same nominal value behave completely differently across all three. The litigation matter might have lumpy recognition tied to phases, lower realization if it settles early, and cash that trails invoices by 60–90 days. The flat-fee deal recognizes on milestones and often collects faster. Averaging them into a single weighted pipeline hides exactly the information you need.
The firms that get burned aren't the ones with weak demand. They're the ones whose forecast treated a stage-2 matter with a slow-paying institutional client the same as a stage-4 matter with a retainer already sitting in trust.
Start with stage probabilities, but make them honest
Every firm already has stages — intake, engaged, active, resolution, closed — even if they're informal. If you've formalized them, you probably built off something like the case lifecycle framework with defined stages and SLA rules. The problem is rarely the stages themselves. It's the probabilities attached to them.
Never miss a critical deadline again.
Casioly helps legal teams manage cases efficiently and stay on top of critical tasks.
- Centralized case tracking
- Automated deadline reminders
- Secure client communication
No credit card required
What happens across a lot of firms is that stage probabilities get set once, optimistically, and never revisited against actual conversion. A partner decides "prospects at the proposal stage close about 70% of the time" because it feels right, and that number becomes gospel. When you actually count what happened over the last 24 months, the real figure is often 45–55%, and it varies by practice area and referral source.
So before building any curve, do the unglamorous work: pull your closed matters from the last two years and calculate real conversion rates by stage and by matter type. You'll get something like this.
| Stage | Litigation (actual conv.) | Transactional (actual conv.) | Notes |
|---|---|---|---|
| Inquiry / intake | ~20% | ~35% | Huge drop-off; most firms overcount here |
| Conflict-cleared, proposal sent | ~40% | ~60% | Transactional closes faster and firmer |
| Engaged, retainer received | ~90% | ~92% | Money changing hands is the real signal |
| Active / mid-matter | ~97% | ~95% | Attrition low but scope risk high |
The insight most people miss: the biggest probability cliff is almost always at intake, not at the proposal. Firms obsess over closing proposals while quietly letting half their intake pipeline evaporate. If your forecast weights inquiries at 50%, you're baking in a fantasy.
Calculate conversion rates by practice area and referral source separately to avoid averaging away important differences.
If your forecast weights inquiries at 50%, you're baking in a fantasy.
Layer realization on top — because "recognized" isn't "engaged"
Once a matter is engaged, the next question is how much of it you'll actually recognize. This is where budgeting discipline pays off directly. If you've built stage-tied budgets using something like a standard cost-driver taxonomy with partner accountability, you already have the raw material — a phase-by-phase expectation of value.
-
Scope drift with no change order — work performed, then written down because the client pushes back.
-
Fee caps and blended-rate concessions made at engagement and then forgotten by the billing team.
-
Phased matters that settle early — you budgeted through trial, it resolved at mediation, and half the projected revenue never materializes.
A realistic realization assumption for a lot of small firms sits somewhere in the 82–91% range, but the average is useless for forecasting. What matters is realization by matter type and by phase, because early phases tend to realize higher than late phases where write-downs cluster.
Budgeted phase value × stage probability × phase realization rate = expected recognized revenue for that phase.
Do that for every open phase of every active matter, and you've got a recognition curve that reflects reality instead of the total engagement value.
Sample recognition curve: what it actually looks like
Take a mid-size commercial litigation matter budgeted at $180k across four phases. Here's how recognition maps out once you apply phase realization and the probability the matter reaches each phase.
| Month | Phase | Budgeted | Prob. reached | Realization | Expected recognized |
|---|---|---|---|---|---|
| 1–2 | Pleadings | $30k | 95% | 92% | ~$26k |
| 3–5 | Discovery | $70k | 88% | 89% | ~$55k |
| 6–7 | Motions | $40k | 70% | 85% | ~$24k |
| 8–9 | Trial/settle | $40k | 45% | 80% | ~$14k |
Nominal value: $180k. Probability-and-realization-adjusted recognition: around $119k.
That's a 34% gap between the engagement number and what you should actually plan around — and it's front-loaded. Most of the reliable recognition lands in the first five months. If this firm staffed and spent as if $180k was coming, they'd be fine early and squeezed late.
The recognition curve for this matter isn't a straight line. It's steep early, then flattens as probability drops. Plot ten matters like this and stack the curves, and you get a firm-wide recognition forecast that shows when revenue actually gets earned — not just how much.
The part everyone skips: cash timing vs. accrual
Recognized revenue and cash are not the same event, and the delay between them is where the actual crunch happens. This is the difference between accrual and cash outcomes, and it deserves its own line in the model.
-
The invoice actually goes out (many firms lag here by 2–4 weeks).
-
The client pays (30, 60, 90+ days depending on client type).
-
Or trust funds get applied, which is near-instant if you've got money sitting in trust.
Consider two matters recognizing the same $50k in the same month:
-
Matter A — retainer already in trust. Recognition and cash are essentially simultaneous. You bill against trust and the cash effect lands within days.
-
Matter B — institutional client, net-60 terms, invoice sent mid-month after a partner review delay. That $50k recognized in March doesn't hit the bank until late May, maybe June.
On an accrual dashboard, March looks identical for both. On a cash dashboard, they're two months apart. A firm running purely off accrual thinking will feel confident in March and then wonder why the operating account is thin in April.
The pattern worth internalizing: contingency and hourly matters with institutional clients create the widest recognition-to-cash gaps. Flat-fee and retainer-backed work closes that gap. If your pipeline is heavy on the former, your cash forecast needs to lag your recognition forecast by a realistic collection cycle — often 45–75 days.
Dashboard wireframe: showing cash vs. accrual side by side
A forecast nobody can read is a forecast nobody uses. The goal is a view where a partner can glance and immediately see the divergence between earned and collected. Here's a text wireframe of what that dashboard should show.
Top row — three headline tiles:
``
[ WEIGHTED PIPELINE ]   [ EXPECTED RECOGNITION ]   [ FORECAST CASH ]
   $2.4M nominal            $1.6M (prob×real)          $1.1M next 90 days
``
Middle — the divergence chart (the whole point):
``
$
|          .-- Recognition (accrual)
|        .-'
|      .-'      .-- Cash (collected)
|    .-'      .-'
|  .-'     .-'
|.'.-'___ months
 M1  M2  M3  M4  M5  M6
``
The visible gap between the two lines is your working-capital exposure. When that gap widens, you're recognizing revenue faster than you're collecting it — fine if you have reserves, dangerous if you're running lean.
Bottom — matter-level table flagging the outliers: matters with high recognized value but no invoice sent, or long-dated collections concentrated in one month. This is where a well-built operational view earns its keep; the principles behind matter-level dashboards that don't mislead apply directly here — a cash forecast built on vanity numbers is worse than no forecast.
A worked process for building this yourself
If you want to stand this up without boiling the ocean, here's a sequence that works.
-
Pull two years of closed matters and calculate actual stage conversion by matter type. Ignore your assumed rates.
-
Compute realization by phase, not just overall — find where the write-downs actually cluster.
-
For each open matter, break the remaining budget into phases and apply probability × realization to each.
-
Sum by month to build your recognition curve.
-
Apply a collection lag to each matter based on its client type and fee structure to derive the cash curve.
-
Overlay both curves and mark the months where the gap exceeds your comfort threshold.
-
Rerun monthly with actuals, and adjust probabilities as real conversion data accumulates.
The magic isn't in step one or six. It's in step seven. A forecast built once and frozen decays fast. One that gets corrected against reality every month gets sharper every quarter.
A simple workflow of the sequence looks like this.
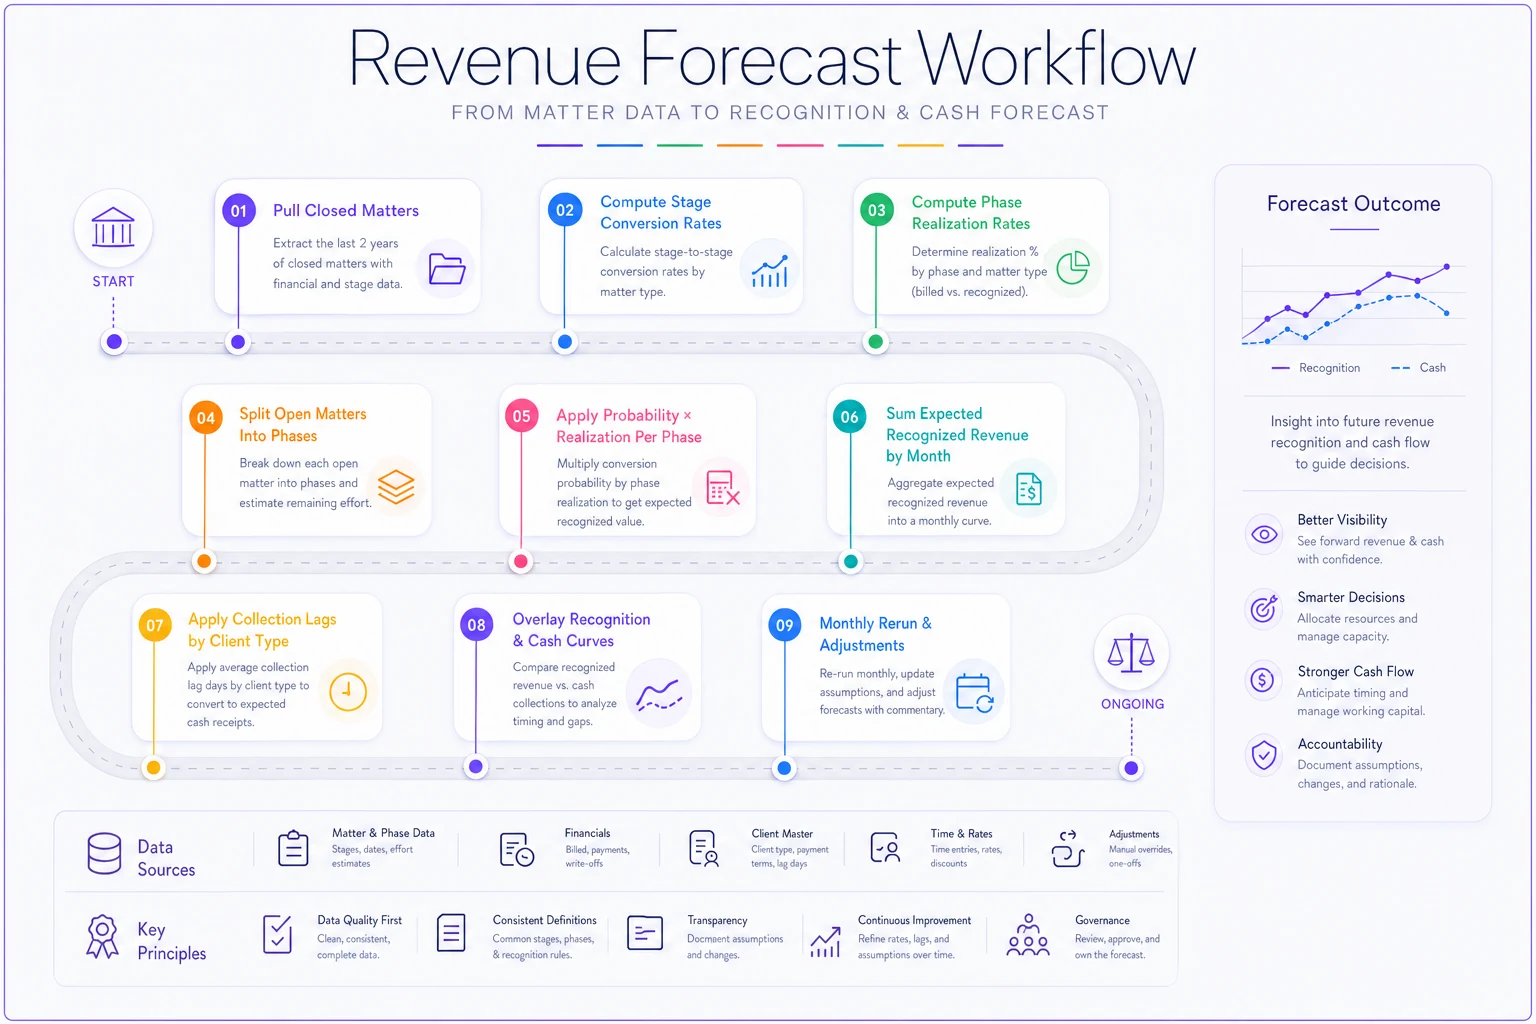
The magic isn't in step one or six. It's in step seven. A forecast built once and frozen decays fast.
A quick checklist before you trust the number
Before any partner makes a staffing or spending decision off this forecast, run through:
-
[ ] Are stage probabilities based on actual historical conversion, not gut feel?
-
[ ] Is realization broken out by phase and matter type?
-
[ ] Does every matter have a collection lag assigned to its client type?
-
[ ] Are trust-backed matters flagged separately (cash ≈ recognition)?
-
[ ] Have you identified any single month where collections concentrate dangerously?
-
[ ] Does the dashboard show accrual and cash as two distinct lines?
-
[ ] Is there a recurring monthly cadence to reconcile forecast vs. actual?
If you can't check all seven, you're forecasting billings, not cash.
When this level of modeling actually makes sense — and when it doesn't
When it's worth it: firms with lumpy matter values, a mix of fee structures, contingency exposure, or a history of feeling cash-tight despite decent billings. If your revenue arrives in uneven waves, this model pays for itself the first time it warns you about a thin month.
When it's overkill: a small firm doing almost entirely flat-fee work with retainers collected upfront. If recognition and cash are basically the same event, a simpler pipeline view is fine. Building elaborate curves for a business where cash follows recognition by three days is effort spent for nothing.
Who should NOT bother yet: firms without clean stage data or reliable budgets. Garbage probabilities produce confident-looking, dangerously wrong forecasts. Fix your stage definitions and budgeting discipline first, then layer this on top. A precise forecast built on bad inputs is more harmful than an honest "we're not sure."
A real scenario
A seven-attorney litigation and transactional firm kept hitting quarters where the P&L looked healthy but the operating account didn't. Year-to-date they'd recognized close to $2.9M, yet twice in eighteen months they'd delayed partner distributions because cash ran short.
When they rebuilt their forecast to separate recognition from cash, the cause was obvious in about an hour. Roughly 40% of their recognized revenue came from hourly institutional clients on net-60 or worse, and their own invoicing lagged another two to three weeks past month-end. So a dollar recognized in month one wasn't collectible until nearly month three — and their staffing spend was pacing to the recognition curve, not the cash curve.
The fix wasn't more work. They flagged trust-backed vs. lagged matters on a single dashboard, tightened invoice-out timing to within a week of month-end, and started planning distributions against the cash line instead of the recognition line. The next two quarters had no distribution delays, and a projected thin month in Q3 — which the old forecast never would have surfaced — got caught eight weeks early, giving them time to accelerate a couple of collections instead of scrambling.
Nothing about their demand or headcount changed. They just stopped confusing three different numbers for one.
The takeaway
Surprise shortfalls almost never come from a sudden drop in work. They come from a forecast that quietly assumes engaged equals recognized, and recognized equals collected. Those assumptions hold right up until the month they don't — and by then you're already staffed and committed against money that hasn't arrived.
Separate the three variables. Build stage probabilities off real conversion, apply realization phase by phase, and lag your cash curve behind your recognition curve by however long your clients actually take to pay. Put both curves on one screen. The gap between them is the most useful number in your firm, and most firms never look at it until it's already a problem.
Ready to elevate your legal practice management?
Join 500+ law firms using Casioly to optimize case workflows, reduce administrative burden, and improve client satisfaction.