



Most law firms track vanity metrics that look impressive in partner meetings but tell you nothing about operational health. You know the ones—total billable hours, number of new matters opened, revenue per lawyer. Meanwhile, your realization rates are tanking, matters are stalling in discovery, and nobody can explain why profitability keeps sliding despite everyone billing more hours.
The problem isn't tracking metrics. It's tracking metrics at the wrong level of granularity. Firm-wide averages hide the operational breakdowns happening at the matter level, where work actually gets done and profits actually get made or lost.
Why Traditional Law Firm Metrics Create Blind Spots
Law firm operational metrics typically flow from financial systems built for accounting, not operations. Your practice management system spits out reports showing total WIP, total AR, average collection periods. Partners nod at the numbers during monthly meetings. Nothing changes.
These aggregated metrics create dangerous blind spots. A firm showing healthy 85% realization might have half its matters running at 95% and the other half bleeding out at 75%. The average looks fine. The operation is broken.
The disconnect happens because law firms treat operational data like financial reporting instead of operational intelligence. Financial reports tell you what happened last quarter. Operational dashboards need to show you what's breaking right now, at the matter level, before it shows up in your P&L three months later.
A partner sees the firm's overall realization rate dropped two points. They send an email about improving time capture. Meanwhile, the real issue is three large litigation matters where associates are writing off time because the budget assumptions were wrong from day one. The firm-level metric triggered the wrong intervention because it obscured the matter-level problem.
The Matter-Level Data Architecture That Changes Everything
Building effective operational dashboards starts with restructuring how you think about data hierarchy. Stop thinking firm → practice group → timekeeper. Start thinking firm → matter type → matter stage → specific matter → timekeeper activities.
Never miss a critical deadline again.
Casioly helps legal teams manage cases efficiently and stay on top of critical tasks.
- Centralized case tracking
- Automated deadline reminders
- Secure client communication
No credit card required
Traditional Hierarchy (Financial Focus):
-
Firm Total Revenue
-
Practice Group Revenue
-
Individual Lawyer Revenue
-
Monthly/Quarterly Breakdowns
Operational Hierarchy (Matter Focus):
-
Matter Type Performance
-
Matter Stage Efficiency
-
Individual Matter Health
-
Task-Level Execution
The difference seems subtle until you realize it completely changes what problems you can see and solve. When you organize data around matters instead of timekeepers, patterns emerge that were invisible before.
You might discover that employment litigation matters consistently blow through budgets during document review, but only when handled by certain team combinations. Or that M&A matters have great realization until they hit regulatory approval stages, where write-offs spike. These patterns are invisible in timekeeper-centric reporting but jump out in matter-centric dashboards.
Core KPIs That Actually Predict Operational Performance
Matter Velocity Score
This isn't just about how long matters take. It's about movement through defined stages relative to matter type benchmarks.
Calculation: (Days in Current Stage / Benchmark Days for Stage) × (Stages Completed / Total Expected Stages)
A matter stuck at 0.3 velocity for two weeks signals operational breakdown before it becomes a client complaint. Track this weekly, not monthly.
Most firms track total matter duration, which tells you nothing until the matter closes. Velocity scoring shows you which matters are stalling in real-time, while you can still intervene.
Realization Decay Rate
Forget looking at final realization rates. Track how realization degrades through matter lifecycle.
Calculation: (Current Period Realization - Previous Period Realization) / Days Between Measurements
A decay rate over 0.5% daily means you're hemorrhaging value somewhere in the workflow. This metric catches problems while they're still fixable, not after close when all you can do is write off time.
One mid-size firm discovered their realization decay accelerated dramatically around day 45 of matters. Turned out that's when junior associates rotated off matters, and handoff protocols were broken. They never would have spotted this looking at final realization rates.
Work Distribution Efficiency
This measures whether work flows to the right level of expertise, not just whether people are busy.
Calculation: (Hours at Appropriate Level / Total Hours) × (Target Rate for Level / Actual Blended Rate)
When this drops below 0.75, you're either over-leveraging seniors or under-utilizing juniors. Both kill profitability.
Matter Budget Confidence Index
Static budgets are worthless. Track how confidence in matter budgets changes as work progresses.
Calculation: (Remaining Budget / Remaining Estimated Work) × (Historical Accuracy Rate for Matter Type)
Anything below 0.8 means you need to have a conversation with the client now, not when you send the final invoice.
Most firms treat budgets as fixed constraints instead of living estimates. This index gives you permission to adjust expectations based on operational reality, not wishful thinking.
| KPI | Calculation |
|---|---|
| Matter Velocity Score | (Days in Current Stage / Benchmark Days for Stage) × (Stages Completed / Total Expected Stages) |
| Realization Decay Rate | (Current Period Realization - Previous Period Realization) / Days Between Measurements |
| Work Distribution Efficiency | (Hours at Appropriate Level / Total Hours) × (Target Rate for Level / Actual Blended Rate) |
| Matter Budget Confidence Index | (Remaining Budget / Remaining Estimated Work) × (Historical Accuracy Rate for Matter Type) |
A decay rate over 0.5% daily means you're hemorrhaging value somewhere in the workflow. This metric catches problems while they're still fixable, not after close when all you can do is write off time.
Building the Actual Dashboard Architecture
Raw KPIs mean nothing without proper visualization and context. Here's the three-layer dashboard structure that makes metrics actionable:
Layer 1: Matter Health Matrix
Create a grid visualization with matters as rows and health indicators as columns. Use color coding, not numbers, for rapid pattern recognition.
-
Budget Status (Green
On track, Yellow: 80-90%, Red: Over 90%)
-
Velocity Score (Green
>0.8, Yellow: 0.5-0.8, Red: <0.5)
-
Team Utilization (Green
Balanced, Yellow: Concentrated, Red: Bottlenecked)
-
Client Response Time (Green
<24hr, Yellow: 24-48hr, Red: >48hr)
-
Document Completion (Green
On schedule, Yellow: 1-3 days behind, Red: >3 days)
Partners should be able to scan this in 10 seconds and know which matters need attention. No math required.
Layer 2: Drill-Down Diagnostics
When someone clicks on a red indicator, they need immediate context, not more metrics.
-
Last three actions taken on the matter
-
Current blockers with ownership
-
Time since last client communication
-
Budget burn rate for past 7 days
-
Team members who logged time this week
This isn't about comprehensive reporting. It's about giving enough context to make a decision right now.
Layer 3: Predictive Indicators
Use historical patterns to flag matters before they go red.
-
Team composition mismatches
-
Scope creep indicators
-
Client responsiveness patterns
-
Deadline clustering
-
Resource conflicts
A matter doesn't need to be failing to need attention. Sometimes preventing future failure is the highest value intervention.
A simple visual showing how alerts flow from detection to partner intervention helps adoption.
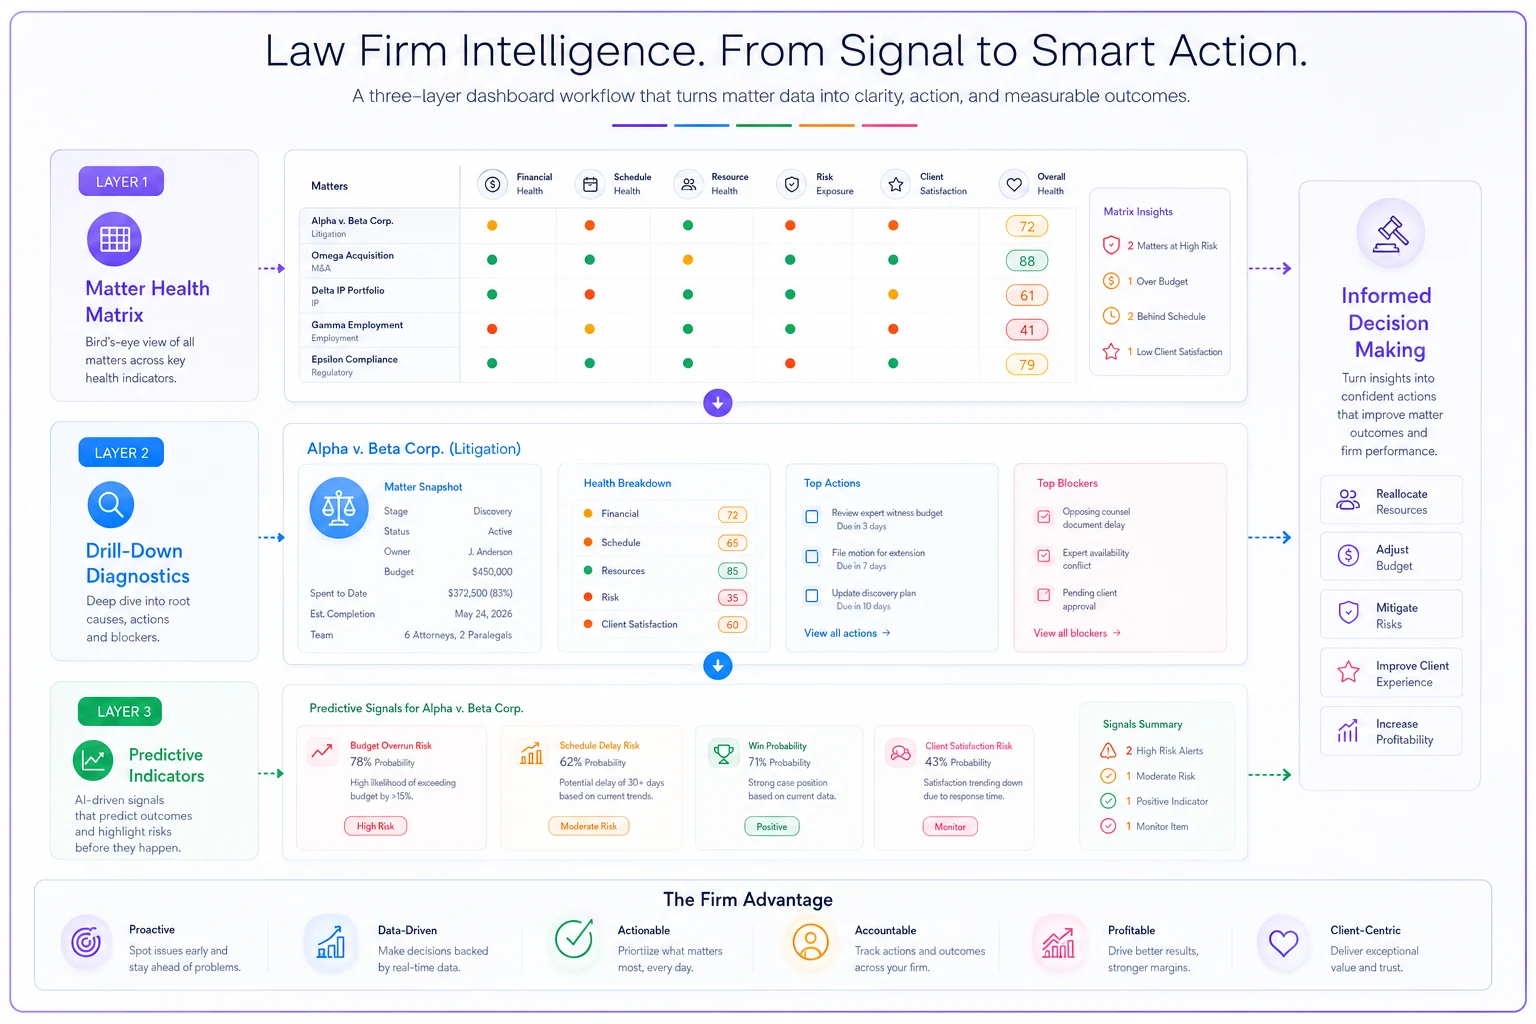
This sketch shows how a red cell in the matrix leads to drill-down context and predictive signals that prompt action.
The Data Mapping Process That Makes or Breaks Implementation
Most dashboard projects fail during data mapping. Not because the technology doesn't work, but because firms try to map their messy operational reality onto clean database schemas.
Step 1: Matter Type Standardization
You probably have 47 different ways attorneys describe the same type of matter. Map these to no more than 12 operational categories. Legal nuances don't matter here—operational patterns do.
-
"Commercial litigation - breach of contract" → Litigation - Commercial
-
"Contract dispute resolution" → Litigation - Commercial
-
"Vendor agreement enforcement" → Litigation - Commercial
Map the highest-volume matter types first to get early wins and quicker validation.
Step 2: Stage Definition by Matter Type
Generic stages like "Open," "Active," "Closed" tell you nothing. Define operational stages that reflect how work actually flows.
Litigation stages might be:
-
Initial Assessment & Strategy
-
Pleadings & Discovery Planning
-
Document Collection & Review
-
Deposition Preparation & Execution
-
Motion Practice
-
Settlement Negotiations
-
Trial Preparation
-
Post-Trial Motions
Transaction stages completely different:
-
Initial Structuring
-
Due Diligence Coordination
-
Document Drafting - First Turn
-
Negotiation Rounds
-
Regulatory Filings
-
Closing Preparation
-
Post-Closing Items
Step 3: Field-Level Data Requirements
For each KPI, map exactly which fields need to be populated and when. Most firms fail here because they assume data exists when it doesn't.
Required fields for Matter Velocity Score:
-
Matter Open Date (system-generated)
-
Current Stage (manually updated weekly)
-
Stage Entry Date (system-tracked)
-
Expected Stage Duration (pulled from matter type template)
-
Stage Completion Criteria (predefined checklist)
Without all five fields, the metric becomes meaningless. Plan for this before building anything.
Common Implementation Failures and How to Avoid Them
The "Perfect Data" Trap
Firms wait for perfect data before launching dashboards. Perfect data never comes. Start with 70% accuracy and improve through usage.
One firm spent 14 months trying to clean historical data before launching their dashboard. By the time they finished, the business had changed enough that their metrics were already outdated. Another firm launched with imperfect data, used the dashboard to identify data gaps, and had better operational visibility within 6 weeks.
The Partner Adoption Wall
Partners won't use dashboards that make them look bad or require behavior change. Build their view to highlight wins and opportunities, not failures.
Instead of showing "Partners with worst realization," show "Matters with highest improvement potential." Same data, different framing, completely different adoption rate.
The Integration Death Spiral
Trying to integrate every system before launch kills momentum. Start with core practice management data, add other sources iteratively.
Your practice management system has 80% of what you need. Document management adds 10%. Time and billing adds another 5%. The last 5% isn't worth delaying launch by six months.
When Automation Transforms Dashboard Reliability
Manual data entry kills dashboard accuracy within weeks. The gap between operational reality and dashboard display grows until nobody trusts the numbers.
This is where AI-powered operational software becomes essential. Not as a magic solution, but as the connective tissue that keeps data flowing accurately between systems. When matter stages update automatically based on document filings, when budget warnings trigger from time entry patterns, when client communication delays flag without anyone checking—that's when dashboards become operational tools instead of reporting exercises.
The automation layer doesn't replace human judgment. It eliminates the manual work that prevents humans from exercising judgment. A partner should be deciding how to rescue a struggling matter, not manually updating its status in three different systems.
Modern platforms can track matter progression through document creation patterns, email flows, and calendar events. They spot when matters stall, when team utilization becomes imbalanced, when realization starts decaying. This isn't about replacing lawyers with robots. It's about giving lawyers operational intelligence that was previously invisible or required hours of manual analysis to uncover.
Building Your Implementation Roadmap
Start small, prove value, then expand. Here's a realistic 90-day progression:
Days 1-30: Foundation
-
Map your 5 highest-volume matter types
-
Define stages for each type
-
Identify data sources
-
Build Matter Health Matrix for these 5 types only
Days 31-60: Refinement
-
Launch dashboard to pilot group (pick early adopters)
-
Gather feedback on metric relevance
-
Adjust calculations based on operational reality
-
Add drill-down capabilities
Days 61-90: Expansion
-
Roll out to broader group
-
Add predictive indicators
-
Integrate automation for data updates
-
Document successful interventions triggered by dashboard insights
The goal isn't perfection. It's operational visibility that improves decision-making speed and quality.
The Operational Transformation That Follows
When law firm operational metrics shift from financial aggregates to matter-level intelligence, the entire practice changes. Partners stop asking "How many hours did we bill?" and start asking "Which matters are at risk?" Associates stop padding time entries and start flagging operational bottlenecks. Clients stop getting surprise bills and start seeing proactive budget communications.
The transformation doesn't happen because of the dashboards. It happens because the dashboards make operational reality visible in real-time, at the level where interventions actually matter. A firm that knows every matter's health, velocity, and trajectory operates fundamentally differently than one flying blind with quarterly financial reports.
Most firms won't make this transition. They'll keep tracking vanity metrics, keep having the same partner meetings about improving realization, keep wondering why profitability feels so fragile despite everyone working harder.
The firms that build matter-level operational intelligence will operate in a different league entirely. Not because they work harder or bill more, but because they can see what's actually happening in their operations and intervene before problems become catastrophes.
The question isn't whether your firm needs better operational metrics. It's whether you'll build the infrastructure to capture them before your competitors do.
Ready to elevate your legal practice management?
Join 500+ law firms using Casioly to optimize case workflows, reduce administrative burden, and improve client satisfaction.