
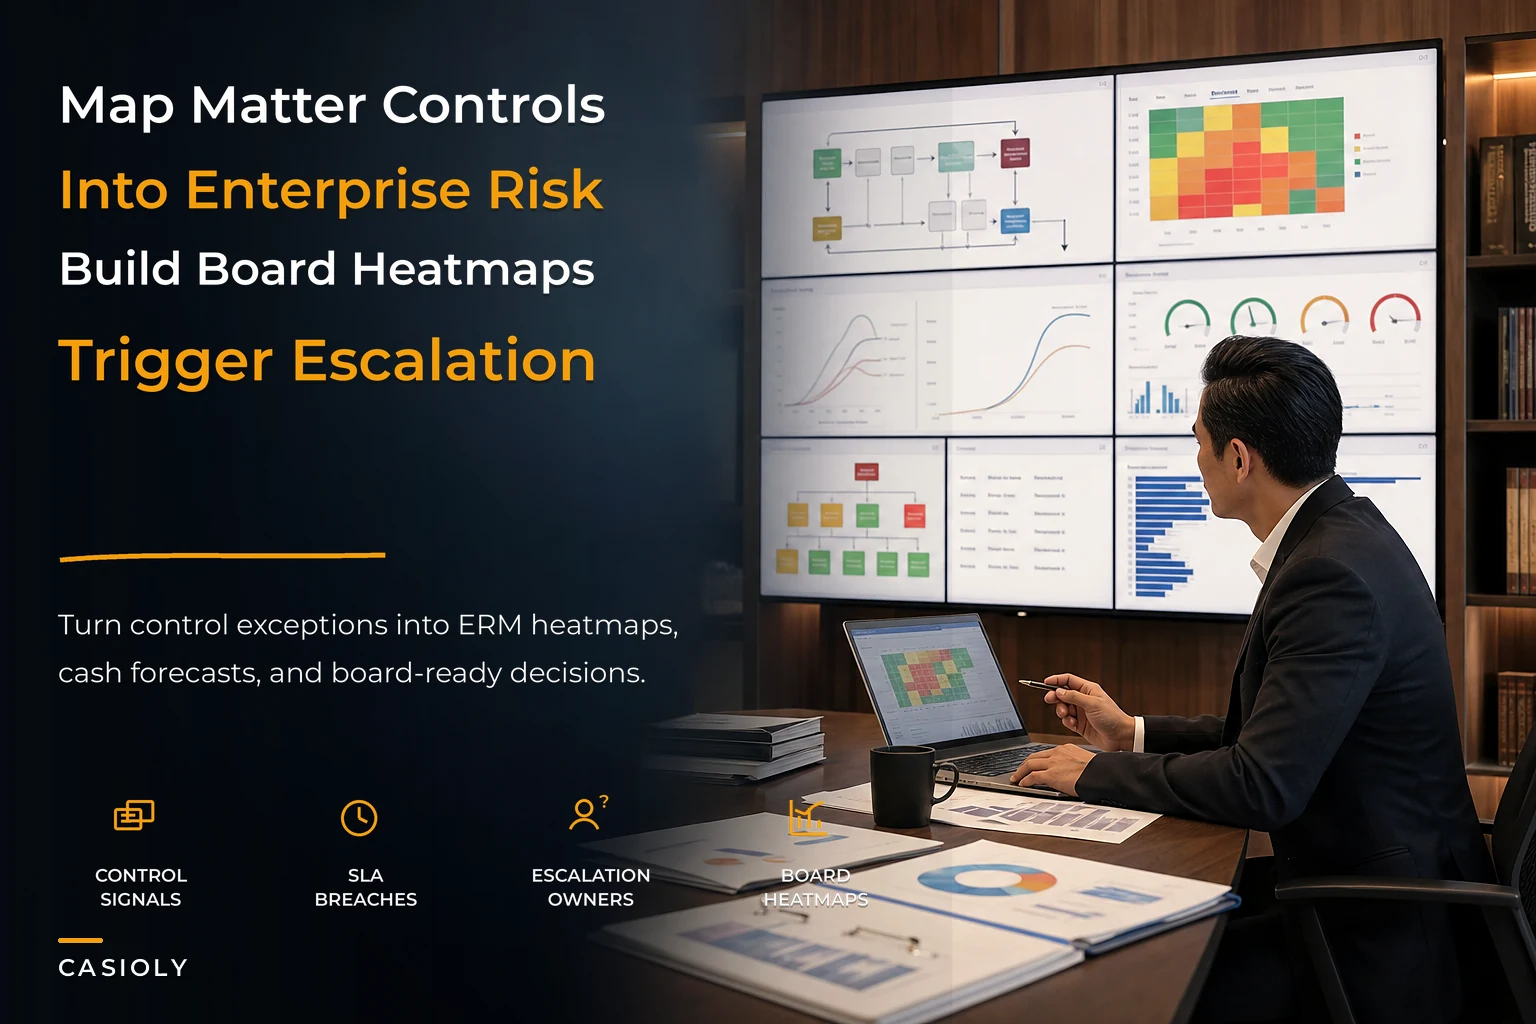

Most firms already generate the raw material for a real enterprise risk program. It's just scattered. A missed calendar date lives in the docketing tool. A trust shortfall sits in the accounting ledger. A stalled collection hides in an AR aging report nobody opens until month seven. An SLA breach is a complaint a partner remembers and nobody logs.
The problem isn't that these signals don't exist. It's that nobody has agreed on how a matter-level event becomes a firm-level risk number — and what number is bad enough to trigger a real conversation. Until you solve that translation problem, your board reporting is a collection of anecdotes dressed up as governance.
This is the mapping layer. It sits above your individual controls and below your board deck. Done right, it takes thousands of small operational signals and rolls them into three things leaders can actually act on: a risk heatmap, a cash-curve forecast, and a set of escalation gates that fire before something becomes a crisis instead of after.
The translation gap nobody owns
Here's the pattern across firms that technically have "risk reporting." The managing partner asks how the firm is doing on risk. Someone pulls four reports. The reports use different matter IDs, different date conventions, and different definitions of what counts as late. Twenty minutes of manual reconciliation later, you get a slide that says "things look mostly fine" — which is exactly the slide that precedes every unpleasant surprise.
The gap exists because matter controls and enterprise risk management grew up in different departments. Controls are owned by practice leads and operations. ERM, when it exists, is owned by a GC or a risk committee that thinks in categories like "regulatory," "financial," "client," and "operational." Nobody owns the wiring between them.
What breaks specifically is aggregation logic. A single matter with a slipped deadline is a task. Forty matters in one practice group with slipped deadlines in the same quarter is a staffing or supervision failure. The signal is identical at the matter level; the meaning only appears when you aggregate. Most firms never build the aggregation rule, so the pattern stays invisible until a malpractice claim makes it obvious.
If you haven't already standardized how individual controls get scored at the stage level, that's the prerequisite work. The Matter-Risk Control Matrix approach to stage-level scoring and control libraries is the layer this article builds on top of — you need consistent matter-level signals before you can roll them into anything meaningful.
Four control families worth mapping first
You don't need to map everything. Four families carry most of the board-relevant risk, and they happen to produce clean, numeric signals.
Never miss a critical deadline again.
Casioly helps legal teams manage cases efficiently and stay on top of critical tasks.
- Centralized case tracking
- Automated deadline reminders
- Secure client communication
No credit card required
| Control family | Raw signal | What it predicts | Natural ERM category |
|---|---|---|---|
| Calendaring / deadlines | Days of slack remaining, missed/rescheduled count | Malpractice exposure, supervision gaps | Operational + professional liability |
| Trust / client funds | Reconciliation variance, days-to-reconcile, negative-balance flags | Regulatory and ethics exposure | Compliance + financial |
| Collections / AR | Aging bucket migration, realization gap, write-off velocity | Cash risk, client-relationship risk | Financial |
| SLA breaches | Response-time misses, stage-duration overruns | Client attrition, reputational risk | Client + operational |
The reason these four work is that each one has a natural threshold a non-lawyer can understand. A trust account out of balance for more than one business day is bad — no legal context needed. A deadline missing its required buffer is bad. You can explain all four to a board member in a single sentence, which is the actual test of whether a risk metric belongs in a board deck.
A common mistake is piling on a fifth, sixth, and seventh family — conflicts, cyber, vendor concentration — before the first four are reliably reconciling. Start narrow. A heatmap built on four clean signals beats one built on nine noisy ones every time.
Aggregation rules: turning events into scores
This is the part firms skip, and it's the part that makes everything else work. An aggregation rule answers one question: how does a pile of matter-level events become a single cell on a heatmap?
A workable rule has three components — a normalization step, a weighting step, and a decay step.
Normalize so practice groups of different sizes compare fairly. A litigation group with 200 active matters will always have more absolute breaches than a small M&A group. So you don't count raw breaches; you count breach rate — breaches per active matter, or per 100 matter-days. This single change prevents the heatmap from permanently punishing your largest group.
Weight by severity, not frequency. Five minor SLA misses on an internal status update shouldn't outweigh one trust reconciliation variance. A rough weighting that holds up well in practice:
-
Trust variance (unresolved > 1 business day)
weight 10
-
Missed hard deadline (court/statutory)
weight 8
-
Collection aged past 120 days on a matter over a dollar threshold
weight 5
-
SLA breach on client-facing commitment
weight 3
-
Internal SLA / soft-deadline slip
weight 1
Decay so last quarter's resolved problem doesn't haunt the heatmap forever. A breach resolved cleanly should fade over 60–90 days. A breach that recurs should not decay — recurrence is itself a signal, often a bigger one than the original event.
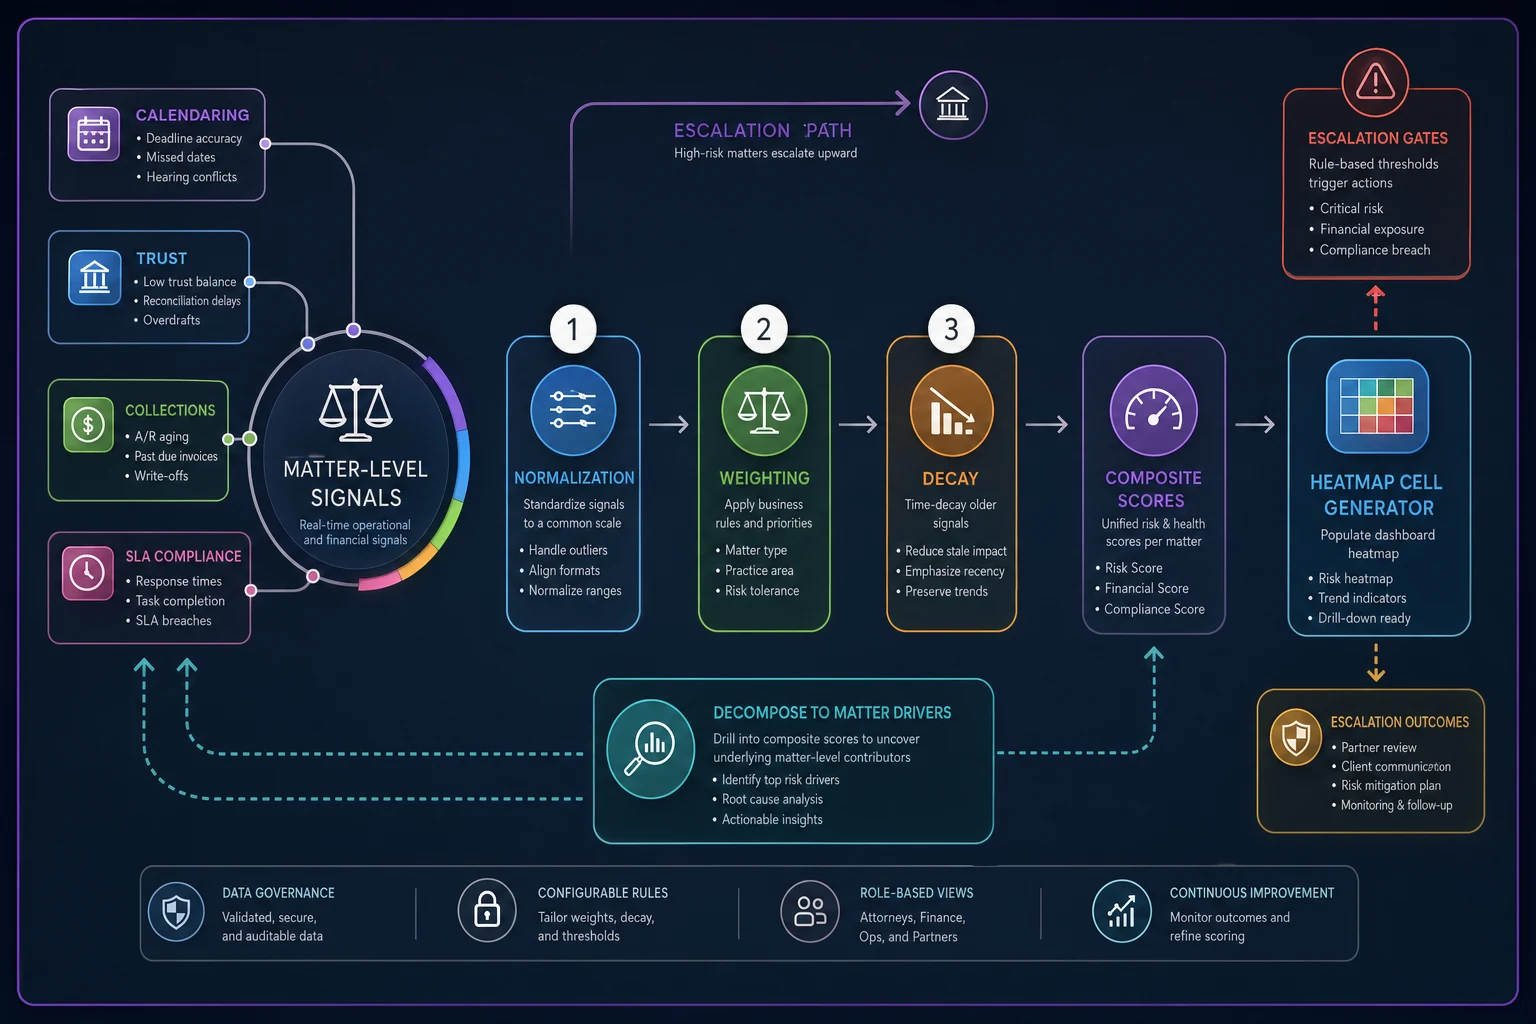
The diagram highlights the normalization → weighting → decay flow that produces the composite score and how that score connects to heatmap coloring and gate escalations.
The output of all three steps is a single composite score per practice group per period. That number is what colors the cell.
A concrete aggregation walkthrough
Picture a seven-attorney practice group over a quarter. They had: one trust variance resolved in two days (weight 10), three hard-deadline near-misses caught by buffer but still logged (weight 8 each = 24), six collections aged past 120 days on sizeable matters (weight 5 each = 30), and a handful of soft SLA slips (roughly weight 6 total).
Raw weighted total: 70. Normalized against around 90 active matters, that's a breach-weight density of about 0.78 per matter. If your amber band starts at 0.5 and red at 1.2, this group lands solidly amber — not a crisis, but the collections cluster is clearly dragging it there. That's a far more useful board statement than "the group had some issues."
The insight most firms miss: once you see the composite, you can decompose it back down. Amber because of collections and amber because of trust are completely different management problems that happen to produce the same color. Always show the color and the dominant driver together.
Building the ERM heatmap
The heatmap's job is to let someone with thirty seconds find the one thing that matters. Practice groups down the rows, control families across the columns, composite score sets the color. One extra column on the right for the group's overall roll-up.
-
Trend arrows beat absolute color. A green cell trending toward amber is more interesting than a stable amber cell. Board members instinctively look for motion. Give it to them.
-
Every red cell needs a named owner and a date. A red cell with no owner is just anxiety on a slide. The heatmap should link to who's accountable and when the next check happens.
-
Cap the colors. If half your map is red, red means nothing. Calibrate thresholds so that in a normal quarter, red is rare and genuinely alarming.
A quiet failure mode here is threshold drift. Someone decides the red band is "too sensitive" because it keeps firing, so they move it. Now the map is calm and useless. If red fires too often, fix the underlying control — don't move the line to make the slide look better.
Cash-curve templates: where risk becomes money
A heatmap tells you where risk is concentrated. A cash curve tells you when that risk becomes a cash problem. These are different artefacts and leaders need both.
The cash-curve template takes your collections and realization signals and projects them forward as expected cash by week or month. The useful version isn't a single line — it's a band. A probability-weighted expectation in the middle, a conservative floor, and an optimistic ceiling.
The mechanics connect directly to stage-level realization. If you've mapped how matters convert through stages into billed and collected revenue — the approach in mapping matter-stage probabilities to realization curves and cash-timing forecasts — the cash curve is largely assembled from work you've already done. You're applying collection-risk discounts to the realization forecast: a matter in a group showing heavy AR aging gets a steeper discount and a later expected-collection date than the same matter in a clean group.
What this surfaces that a standard AR report never will: the timing of thin spots. A firm can be profitable on paper and still hit a week in month two where the expected cash floor dips below payroll. The cash curve makes that visible six weeks out, while you still have levers — accelerate a few collections, delay a discretionary spend, draw on a line. By the time the AR report shows the hole, those levers are gone.
A realistic example: a mid-sized firm ran its first cash-curve band and found the floor scenario dropped to roughly $180k against a monthly nut closer to $240k in a specific four-week window — driven almost entirely by two large matters stuck in a 90–120 day aging bucket. Nothing on the standard dashboard flagged it, because the annual numbers were fine. Chasing those two collections two weeks early closed most of the gap.
Escalation gates: making the numbers do something
A score that nobody has to respond to is a vanity metric. Escalation gates are the pre-agreed rules that convert a threshold crossing into an owned action with a clock on it. They're the difference between a reporting system and a control system.
A clean gate has four parts: the trigger, the owner, the deadline, and the fallback if the deadline passes. The fallback is the part people forget, and it's the part that makes the gate real — without automatic escalation to the next level, every gate eventually gets quietly ignored.
-
Gate 1 — Group lead. Any cell goes amber. Lead acknowledges within 3 business days and logs a plan. No action in 3 days → auto-escalate to Gate 2.
-
Gate 2 — Practice chair / ops lead. Any cell goes red, or amber persists two periods. Written remediation plan with a date within 5 business days. No plan → Gate 3.
-
Gate 3 — GC / risk committee. Trust variance unresolved past 1 business day, any missed hard deadline, or red persisting two periods. Immediate review, mandatory at next committee meeting.
The design principle: gates should be boring to follow and loud to ignore. Following the gate is a routine acknowledgment. Ignoring it generates an escalating, visible trail that lands on someone senior. That asymmetry is what keeps the system alive after the initial enthusiasm fades.
Trust deserves its own hard gate regardless of composite scores — it's the one category where a single event is a genuine emergency. If you don't already run a tight monthly process, the month-end trust reconciliation checklist with ledger mappings and red-flag rules is the control that feeds this gate. The ERM layer doesn't replace that reconciliation; it makes sure a variance that gets caught can't die quietly in the accounting inbox.
Reconciliation checks so the board deck can be trusted
Before any of this reaches a board, the numbers have to survive a basic integrity check. Boards forgive a bad quarter. They don't forgive a slide that turns out to be wrong. One bad number and every future deck gets second-guessed.
-
Count reconciliation. Active matter count in the ERM roll-up matches the practice-management system within a tight tolerance. A big mismatch usually means closed matters are still counting — which deflates every rate.
-
Trust tie-out. Every trust flag in the heatmap maps to a real ledger line. Zero phantom flags, zero suppressed real ones.
-
Aging consistency. Collections buckets in the cash curve match the AR aging report as of the same cutoff date. Different cutoff dates are the single most common reason two "cash" numbers disagree.
-
Gate audit. Every gate that should have fired last period did, and every fired gate has a logged owner response. An un-fired gate is a silent control failure.
-
Driver decomposition. Every amber and red cell can be broken back down to the specific matters that caused it. If you can't name the matters, you can't defend the color.
That last check is the one that earns trust in the room.
Run the monthly reconciliation pass at least two business days before the board packet to leave time for fixes.
When a partner challenges an amber cell, you pull the three matters driving it. The conversation moves from "is this metric right" to "what do we do about these three matters" — which is the conversation you actually want.
Where the manual version falls apart — and what to centralize
You can run a quarterly version of all this by hand. Many firms should start that way to pressure-test their thresholds before automating anything. But the manual version has a hard ceiling.
The breaking point is reconciliation effort. Pulling calendaring from one system, trust from accounting, AR from billing, and SLA data from a case-management tool — then normalizing matter IDs and date conventions across all four — is a multi-day job every period. At a certain scale, the person doing it starts cutting corners. The corner they cut is usually the reconciliation check, which is the one that keeps the deck honest.
This is where connected operational software earns its place: not as a dashboard that generates prettier charts, but as a layer that keeps matter-level signals flowing into one model with consistent IDs, so aggregation and reconciliation run continuously instead of in a frantic pre-board scramble. The value isn't the visualization — it's that gate escalations fire the moment a threshold is crossed rather than being discovered weeks later during manual roll-up. When the plumbing is already connected, assembling the board artefacts stops being a project and becomes a review.
A useful tell for whether to automate: if you've skipped or rushed the reconciliation pass two periods in a row, the manual version has already failed. You're publishing numbers you haven't verified, which is worse than not publishing them at all.
When this full system makes sense — and when it doesn't
When it's worth building: multiple practice groups, a real board or risk committee asking for risk reporting, or a recent near-miss that made leadership nervous. Any firm where risk signals genuinely live in separate systems and separate heads.
When it's overkill: a single small group where the managing partner already sees every matter. Building heatmaps and gate ladders for a handful of matters is governance theater. A weekly ten-minute look at four numbers is enough.
Who should not do this yet: firms without consistent matter IDs or reliable stage data. The mapping layer inherits every data problem beneath it. If your matter metadata is a mess, fix that first — otherwise you'll build a beautiful heatmap on numbers nobody believes, and the whole program loses credibility on its first wrong cell.
A real scenario
A roughly 30-attorney firm with four practice groups had a risk committee that met quarterly and reviewed, in practice, whatever partners happened to raise. Trust was fine. Everyone assumed the rest was too.
Their first mapped heatmap showed one group amber on collections and amber on SLA at the same time — a combination that turned out to mean a specific partner was overloaded and letting both billing follow-up and client updates slip. No single report had caught it, because each individual signal was just under its own informal threshold. Aggregated and weighted, the pattern was obvious.
The cash-curve band from the same exercise flagged a thin window about five weeks out, driven by two large aging matters in that same group. They pulled collection efforts forward and reallocated two matters off the overloaded partner. Over the following two quarters, that group's composite drifted back toward green — and more to the point, the committee stopped meeting to trade anecdotes and started meeting to review three or four named, owned items. The meetings got shorter and the decisions got sharper.
Nothing about the outcome was dramatic. That's the point. The system's job is to make near-misses visible while they're still cheap to fix, so the dramatic version never happens.
Pulling it together
The whole point of mapping matter controls to ERM is to stop treating risk as a story partners tell and start treating it as a signal the firm measures, rolls up, and responds to on a clock.
The four control families give you clean inputs. The aggregation rules turn events into scores. The heatmap shows concentration, the cash curve shows timing, and the escalation gates make sure a crossed threshold produces an action instead of a shrug.
Build it narrow. Reconcile it honestly. Keep the gates boring to follow and loud to ignore. Do that, and your board reporting stops being a quarterly exercise in reassurance and starts being the thing that actually catches the problem six weeks before it would have caught you.
Build it narrow. Reconcile it honestly. Keep the gates boring to follow and loud to ignore. Do that, and your board reporting stops being a quarterly exercise in reassurance and starts being the thing that actually catches the problem six weeks before it would have caught you.
Ready to elevate your legal practice management?
Join 500+ law firms using Casioly to optimize case workflows, reduce administrative burden, and improve client satisfaction.